
Here at Sensonomic we are improving today’s farming practices through computer simulations, applying computer logic to land management. We are modernising farming with spatial data and spatially aware algorithms, developing models where things in the system are tied to a point in space, letting simulations play out in the (silicon) field. To visualise these models, then, we need some open source maps, and creating them is one of the jobs of Lasse Gullvåg Sætre, our Geographer and author of this blog.
As a company, whilst we develop our own software, we are also fans of the Free Software movement, making use of software that other people have written and then made available to the world. We also hope to release some of our own software into the open in the future. On the mapping side, we work with Geographical Information Systems (GIS) – open source maps layered with information points – that are free, libre and open.
Out in the open
We are not the only company to work on and with Open Source software – in fact some of the biggest names in tech have followed this route. Google, Facebook and Amazon have their business models enacted by what is mostly free software, meaning they are built out of software infrastructures that are under open licenses, with published code and liberal usage, modification and redistribution policies. That means you can access the code for a lot of their tools and algorithms, and use it to help develop your own work.
It is now widely recognised that opening up the code for generic building blocks creates benefits and efficiencies for everyone. After all, your value is in the execution of your ideas, not your code or your ability to hide it from everyone else. By sharing results openly no researcher has to reinvent the wheel, but can instead stand on those famously giant shoulders. This is the working principle of openness, the efficiency gained from letting everyone in on it.
This mantra of openness isn’t just limited to software – data is becoming more open as well. In Norway we have kartkatalogen, data.norge.no and several other major repositories of open data with state-of-the-art time series. From Silicon Valley, Google has recently released their Google Dataset Search to index all of the world’s datasets. And from satellites in space, the EU is heavily promoting its Copernicus open data program, delivering high resolution Earth Observation data for free. But data alone isn’t very valuable. At Sensonomic, we want to make the most of these open sources, making it into insight that is accessible and actionable for farming operations.
The Open Geoweb
The web was not built for maps, but for text – and it is open source movements that have allowed the former to flourish. As the W3C has lagged behind in developing these capabilities inside the common web standards, open source web mapping libraries, like Leaflet and Openlayers, have been leading the charge towards creating a web full of spatial information presented through the medium suited for it, namely maps.
In fear of becoming utterly irrelevant, even the old behemoth of proprietary mapping software, ESRI, is now publishing components of its Arc platform as open source. This development has led some to hail the emergence of an open Geoweb, a web of open maps, spatial data and technologies that increasingly link the ephemeral online world to the concrete materialities of physical objects, places and peoples. So as the Open Geoweb is a more general concept, we can say that it refers to what is often built on top of what’s called FOSS4G, or Free and Open Source Software for Geoinformatics.
As in most technology development processes, much of the hard work behind realisation lies in standardisation. This is where the Open Geospatial Consortium comes in, creating industry standards for spatial data that benefit all through efficiency, reusability and interoperability. This too is part of what should more precisely be called ‘developments towards an Open Geoweb.’
Academia is still wrestling with proprietary entanglements, but as the push for open science has become stronger, so has the momentum to move back to communal research tools. This means that today, in both the web and desktop worlds, state-of-the-art is increasingly free for all.
Mapping for all
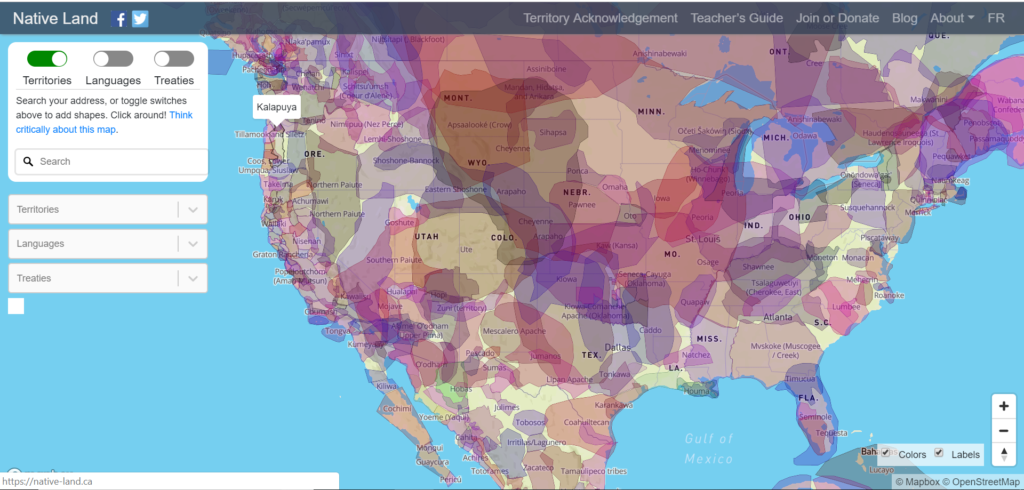
Creating something awesome, then, is no longer limited by access, but what you are able to achieve with this access. Enthusiasts of the Open Geoweb have praised the emergence of such free tools to strengthen democracy, and democratise cartography by allowing regular people to map their realities. Projects made possible by open source software include native-land.ca, a mapping effort to represent the boundaries of Indigenous nations. This map has been used to defend the rights and lands of Indigenous populations, but also to become an arena where conflicts between Indigenous groups crystallised. Another mapping effort known as the The Anti-Eviction Mapping Project describe themselves as a “data-visualisation, data analysis, and storytelling collective documenting the dispossession and resistance upon gentrifying landscapes”. Both of these show how, with these powerful mapping tools available to the public, entirely different stories and perspectives are mapped.
Perhaps the most well known, and impactful, application of the open Geoweb is the Humanitarian OpenStreetMap Team, or HOTOSM for short. OpenStreetMap is the Wikipedia-like, user-generated and open alternative to Google Maps. HOT uses OpenStreetMap’s architecture of collaborative mapping to reach those in need. When disaster strikes, thousands of mappers from all around the world come together, to update information on the stricken area, mapping open roads, buildings, debris and similar from recent satellite imagery. The HOTOSM tasking manager is an excellent place to start mapping in the open.
OpenStreetMap is also one of the many open Geoweb tools that we use here at Sensonomic. We have a number of projects in areas which are not covered well by conventional mapping tools – be that South Pacific islands, Senegal, or Burkina Faso. As we expand our work to help join smallholders to the global value chain, such a mapping tool will be ever more important, and by using these data we also contribute back when finding inaccuracies, missing information and similar.
We would love to hear about other open source mapping projects and success stories. Comment below if you know of any examples!
This blog has been developed as a spin off from a lecture that Sarah M. Przedpelska and I were invited to give on the Geoweb and open GIS at the University of Oslo. We are both UIO alumni, so it was great fun being back in the cafes, halls and auditoriums of UIO.
Following the lecture we ran a HOTOSM Mapathon, and we contributed mapping the Mwanga district of Tanzania for NGOs combating female genital mutilation. Our participation saw the total area mapped go up from 72 % to 74 %. Which in itself is not a lot, but as it often is with community projects, the rising tide lifts all boats.
Lasse and Sarah enjoying their lecturing duties
Comments are closed.
Recent Comments