
Our platform
Sensonomic delivers purpose-built data capture and data storage, enabling you to create immediate and long-term value from your observations throughout the year. With data from key events from the growing season we create predictive insight for yield predictions, sales planning, harvest planning, and logistics.
Start your trial today!Data manager
Integrate efficient solutions
Consistent and structured data is essential for modern farm operations. Our mobile and web applications are built to serve both field registrations, web entries and uploads, and to connect with lab equipment or in-field sensors. Our products provide temporally and spatially specific data entries, enabling integrated traceability and transparency. Additional benefits include granular data points for agronomic management and pest control.
Yield predictor
Predictive farming precision
Our customisable Yield Predictor product provides phased predictions at critical stages of crop development. The analytics output improves your confidence in future delivery contracts, and improves your insight for agronomic and operations planning. You save time on data coordination and management, with all data necessary for yield predictions made available in a flexible database. In our Premium offering you have access to fully manipulate parameters and variables. This enables you to apply your deep knowledge and experience to make the best possible yield predictions – powered by our platform.
Harvest planner
Dynamic and predictive insights
When you record your data in the Sensonomic Agricultural Resource Planning (ARP) platform you receive phased and dynamically updated yield predictions. During the crop maturation phase our software provides you with a harvest plan, and predicts where and when harvest starts. We know there are many considerations you need to make to kick off harvest, and our software allows for manually updating plans as new information is available. Our Harvest Planner product can perform dynamic re-optimisation based on your packaging or processing capacity, the availability of labour and equipment, and weather conditions.
Logistics optimiser
Lorem Ipsum Dolor
Optimal effort at the right time is key for efficiency. With data-based insight you will successfully navigate watering, weather and maintenance, predict amount and time of harvest - which in turn will help you optimise cost in every stage of the supply chain from production to distribution.
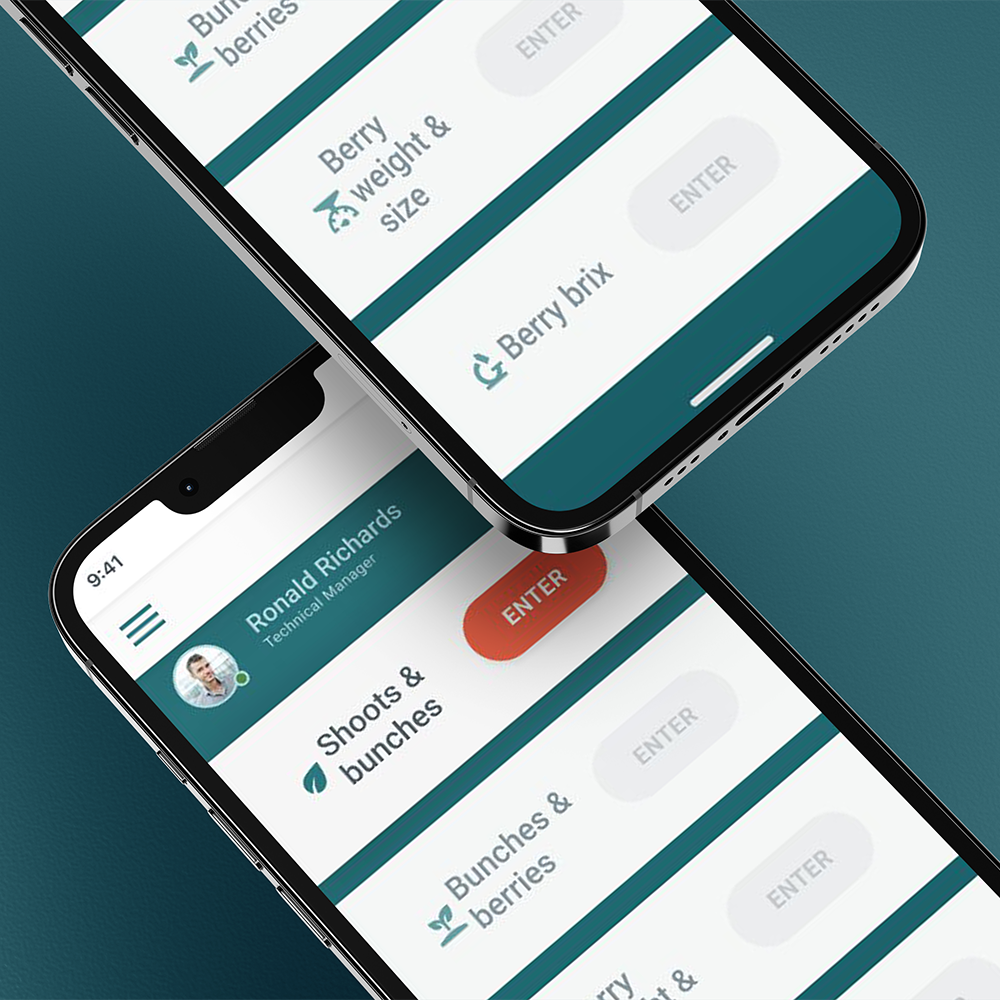
Mobile app
- Capture and store agronomic field data (online and offline)
- Each record includes the location (GPS), sample photo, date, and time of capture
- Solution in use in Peru, Chile, Ecuador, Greece, Italy, Spain, and Portugal
- Available in all languages
- Automatic data verification to prevent incorrect data entries
- Yield performance estimates are updated with each new data record
Software and applications
Web application
- Upload or register data directly on the platform
- Tiered data sharing
- Instant insight of estimated production levels
- Control of processes and tasks/activities
- Detailed quality control through GPS, time stamps, and photos
- Detailed traceability (EUDR and Scope 3)
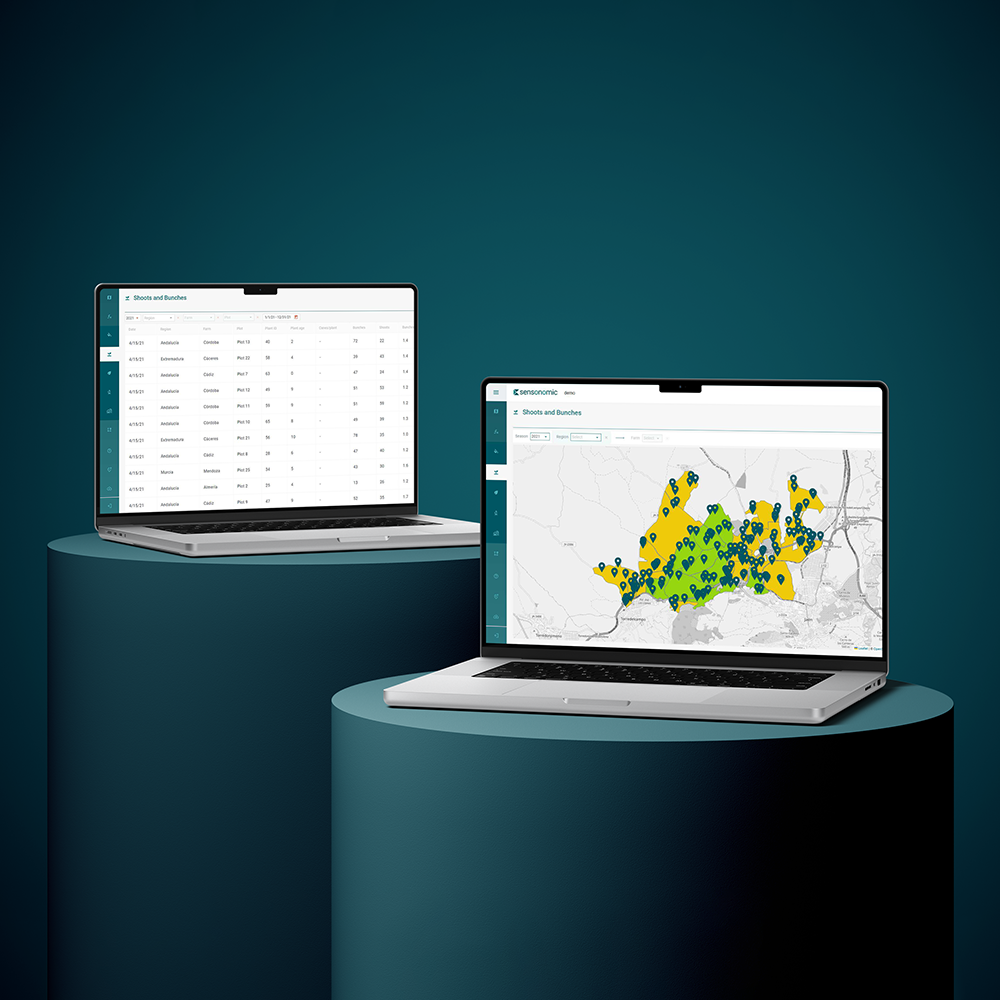
Data visualizations and detailed database
- Instantly updated location-specific data
- Each record includes field location, area, estimated yield, and plant age
- Flexible and adaptable database configuration for different types and scale of producers
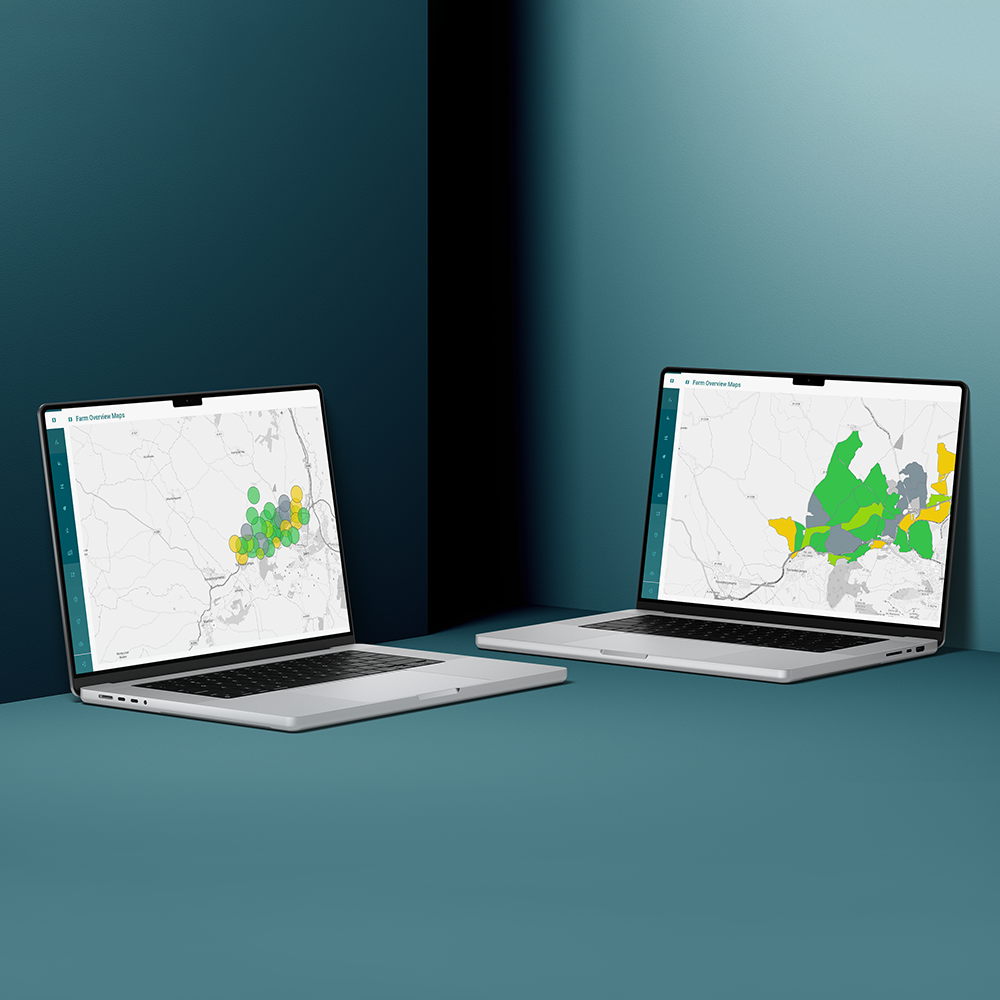
- Build and visualize multi-level operational structures:
- Regions
- Company
- Farm
- Production unit
- Plot
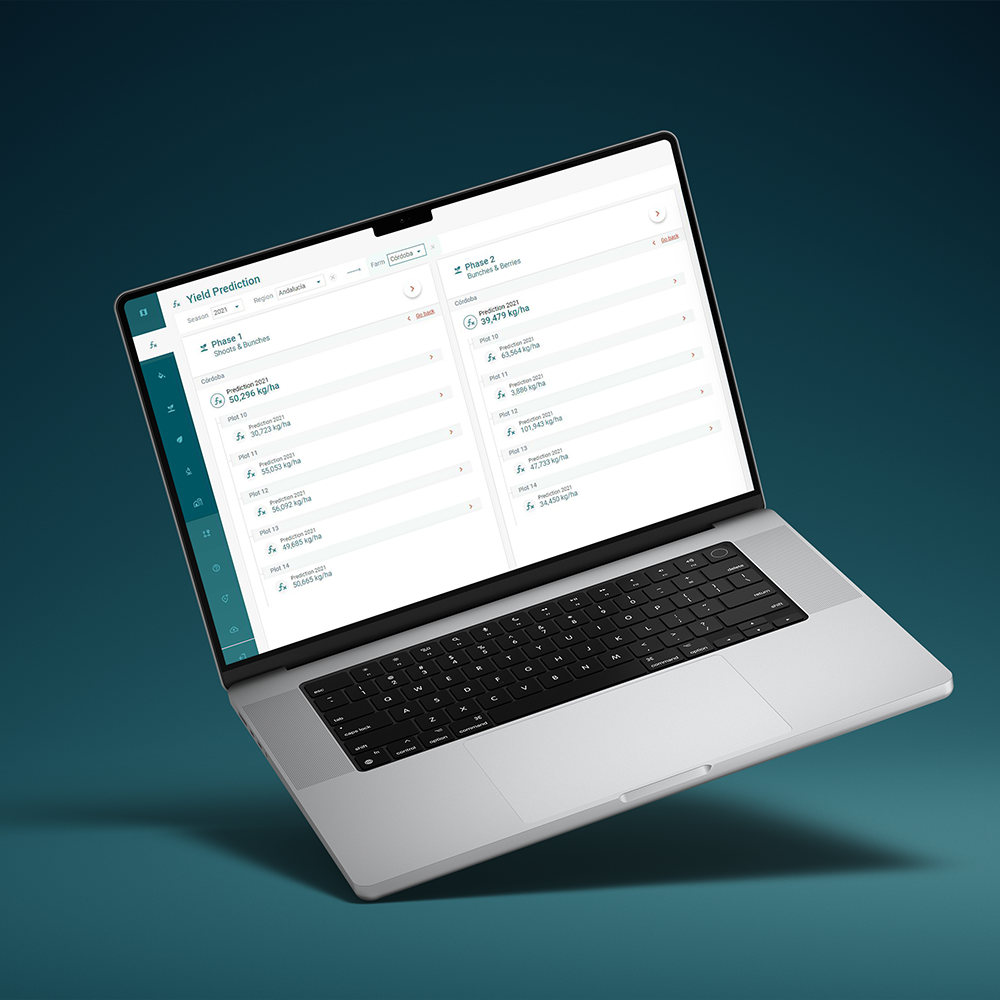
Yield predictions
- Estimates by plot level, and for each phenological stage
- Updated estimates help operations planning and critical business decision
- Model inputs:
- Phase 0: Area (ha); plants/ha; clusters per shoot*; weight per berry*; weight per bunch*
- Phase 1: Clusters per plant; shoots per plant; clusters per bud; average number of clusters per bud
- Phase 2: Clusters per plant; berries per cluster; average number of berries per bunch
- Phase 3: Sample weight; sample size; berry weight; berry size (mm); average berry size; brix; acidity
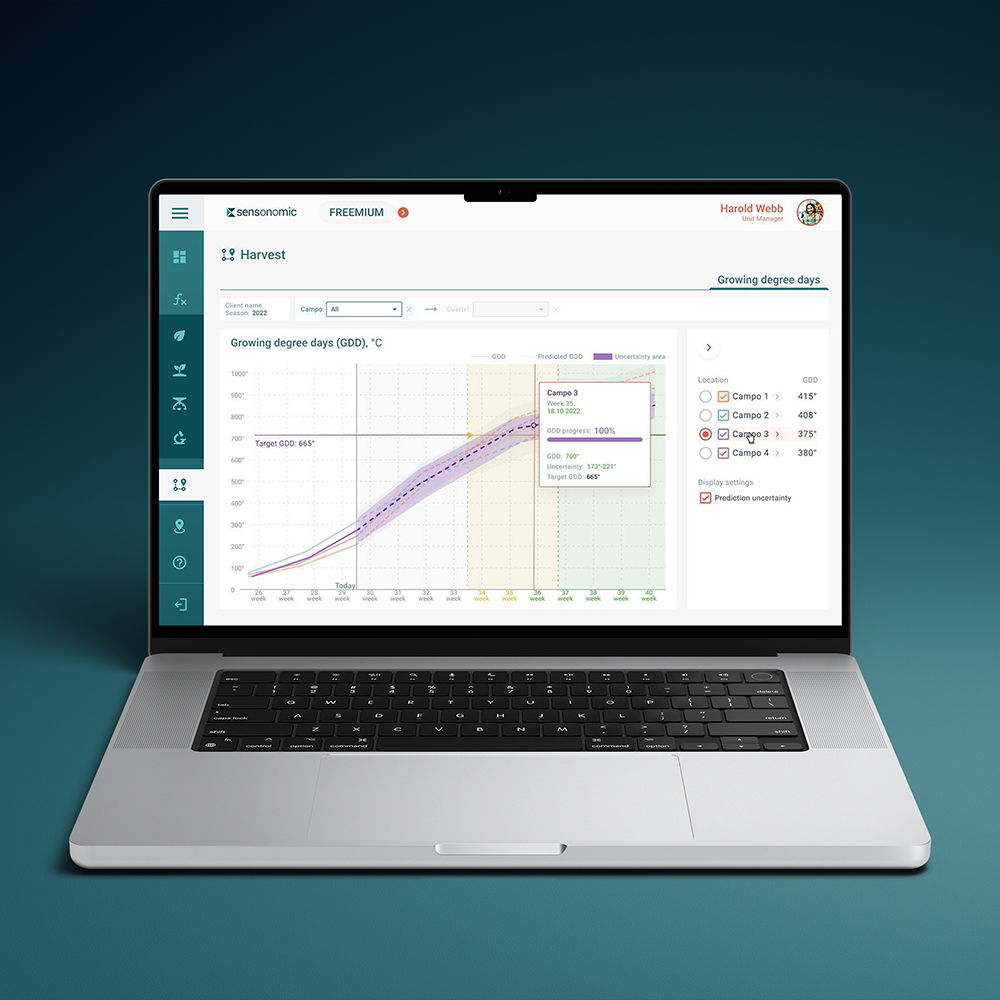
Growing degree days
- Models predicts harvest times per plot level, and can be expanded to include multiple harvests per plot
- Enables more accurate planning of resource allocation
- Improves the management of both agronomic and operational tasks
- Provides earlier and more accurate information on volume and availability for storage, processing, and sales Model inputs:
- Temperature
- Phenological data (fruit set, veraison, brix)
EXTENSIONS
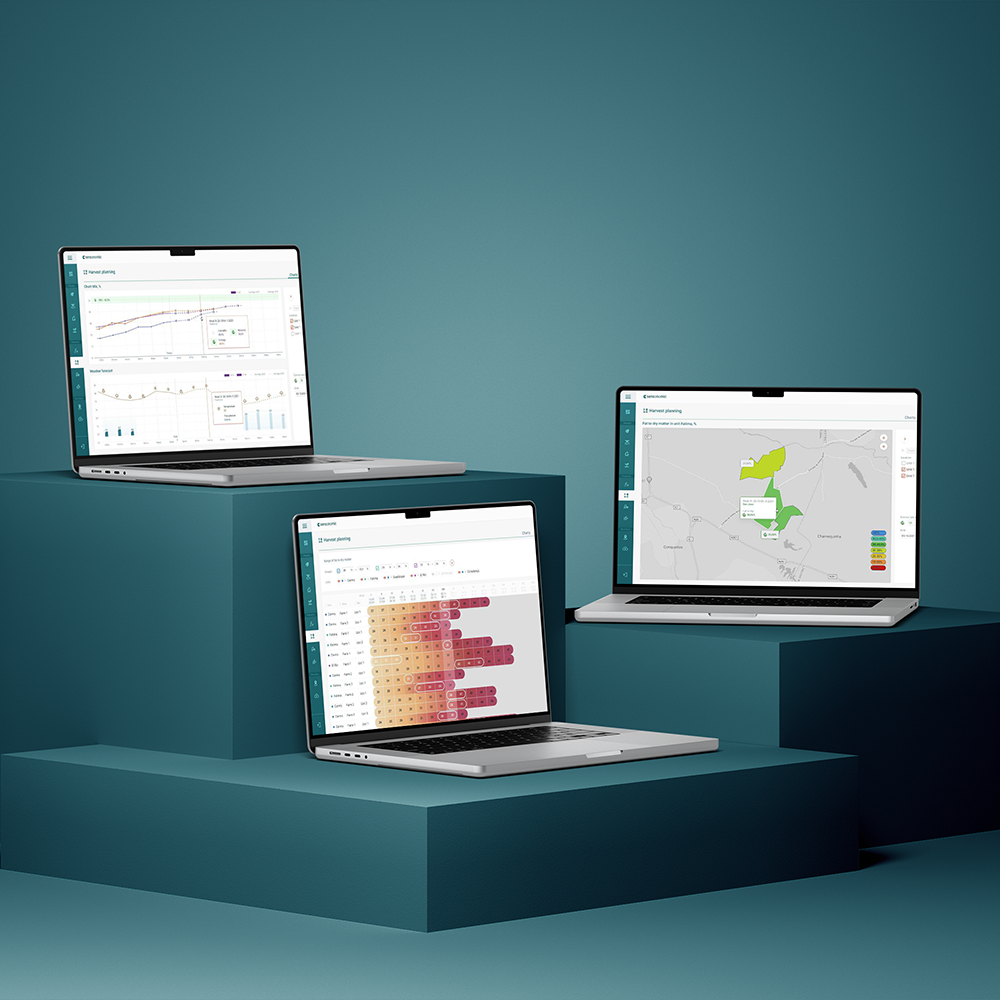
Harvest planning
- Maturation predictions
- Brix, color, and acidity
- Spatial and temporal distribution
- Allows for more precise harvest planning and logistics activities
- Available in dashboard, map, and table view Phases
- Seasonal plan
- t-1 month
- Daily plans
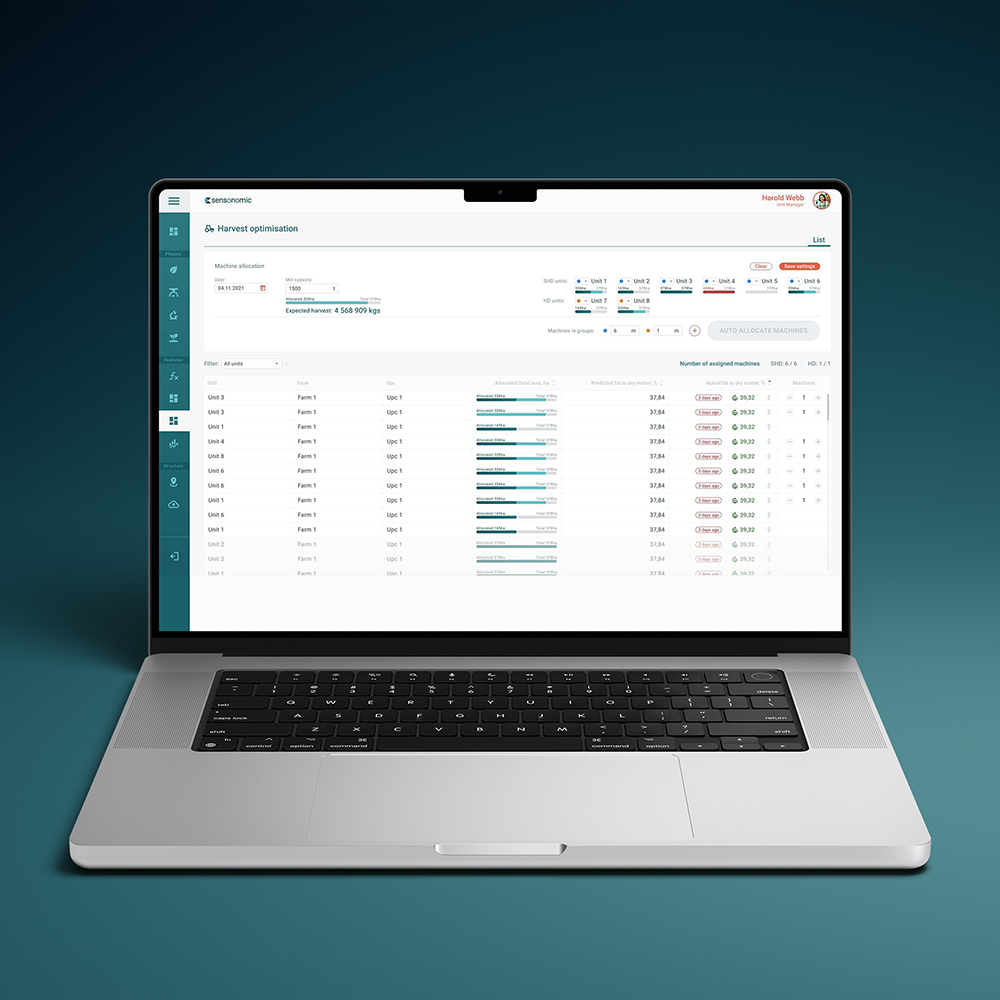
Resource optimisation
- Harvest progress monitoring and allocation of people and vehicles
- Complete control over the deployment of collection vehicles and equipment
- Eliminates expensive bottlenecks with improved planning and immediate insights
- Designed for single and multiple locations, ideal for geographically dispersed fields
Integrated Scope 3 reporting
- 'Category 1 - Goods and Services' upstream reports and 'Category 11 - Use of Sold Products' downstream reports
- Scope 3 relevant events recorded via the mobile and desktop Data input:
- Fires, composting, harvest volume, and addition/subtraction of biomass
- Fertilizer application and efficiency
- Water use and irrigation efficiency
- Phytosanitary treatments
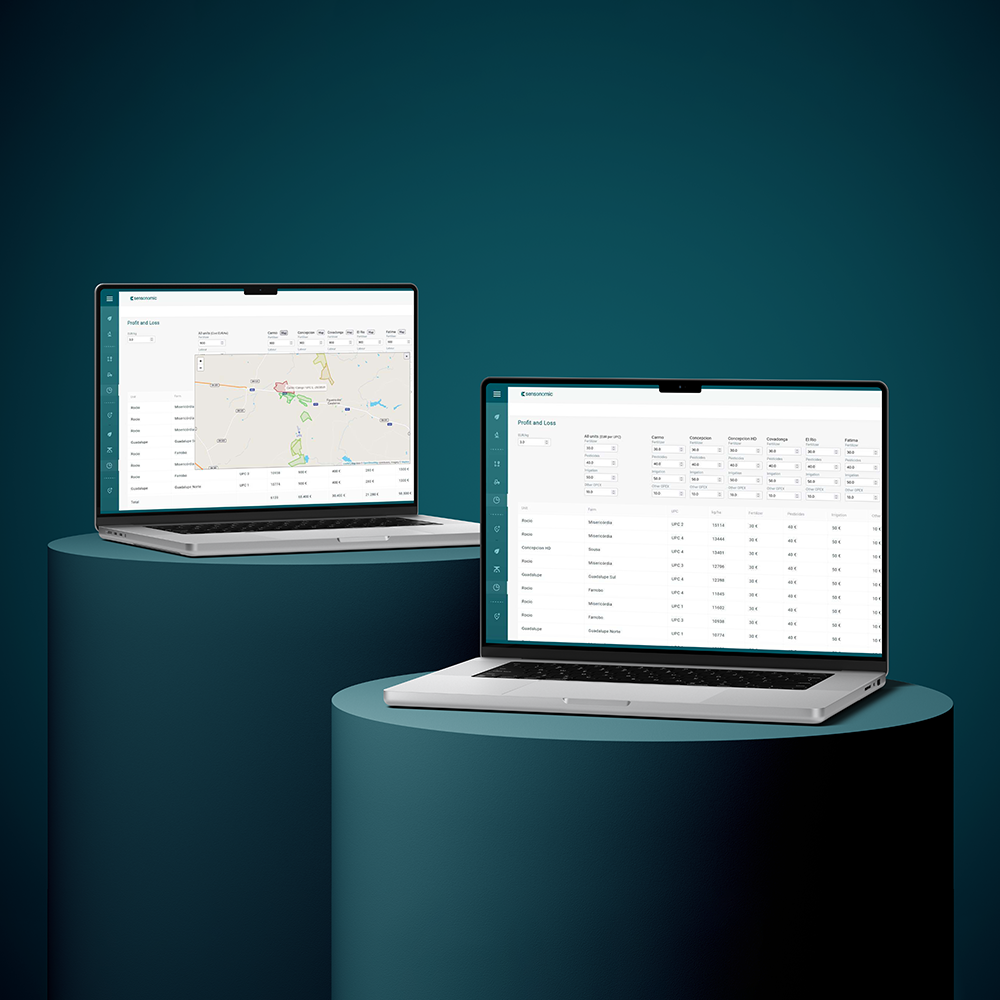

Efficiency of fertilizers, phytosanitary treatment and irrigation
- Registration and analysis of fertilizer application
- Registration and analysis of phytosanitary treatment
- Registration and analysis of irrigation
Comments are closed.